Background
For more background, see the previous post about DefinitelyTyped.
TL;DR: DefinitelyTyped is huge; installing it in its entirety involves processing over 9,000 packages. And that’s slow! Or is it?
Taking a profile
Many people may not know this, but I’ve actually written more Go than I have TypeScript.1 As such, when I have a performance problem, the tool I like to use is pprof.
More commonly, this tool is used when profiling Go, C, C++ code. And I like this tool! Lucky for me, there is a library which lets you use it with Node.2 The API is pretty straightforward; you can start and stop both CPU and heap profiles, and write them to disk.
Unfortunately, that’s a little annoying, because effectively 100% of the time,
I’m profiling a CLI application or someone else’s project where I don’t really
want to inject the code. It does include some code to let you do
node --require=pprof myScript.js, but there’s no way to configure its
behavior.
So a few years ago, I made a little wrapper, pprof-it, which makes things much easier to use. You can check the README for more details, but in short, to get a pprof profile you just run:
$ pprof-it /path/to/script.js
pprof-it will start profiling both CPU and heap allocation immediately at
startup then dump profiles to the current directory on exit. These files can
then be loaded into pprof (or one of the many other tools which support the
format, like flamegraph.com or
speedscope).
So, let’s take a profile of pnpm install on one of my work-in-progress “DT as
a monorepo” branches. (Forgive the roundabout way of running things; some of my
fixes are already released, so I need to do a little movie magic.)
$ npx --package=pnpm@7.30.0 -c 'pprof-it $(which pnpm) install'
This actually OOMs on my laptop (I have yet to determine why), but on my desktop, I get this:
pprof-it: Starting profilers (heap, time)
    # a very long pause...
Scope: all 9031 workspace projects
    # a very very long warning about cycles (I need to file an issue for this!)
Lockfile is up to date, resolution step is skipped
Already up to date
    # another long pause
Done in 1m 39.7s
pprof-it: Stopping profilers
pprof-it: Writing heap profile to pprof-heap-286252.pb.gz
pprof-it: Writing time profile to pprof-time-286252.pb.gz
Great, now let’s run pprof:
$ pprof -http=: pprof-time-286252.pb.gz
Automatically, pprof starts up my browser and puts me right into the graph
view. This view outside of Node profiles is very useful, but Node profiles have
an unfortunate problem which leads to all anonymous (i.e. arrow) functions being
counted as one node named “(anonymous)”.3 So, let’s flip into the
flame view.
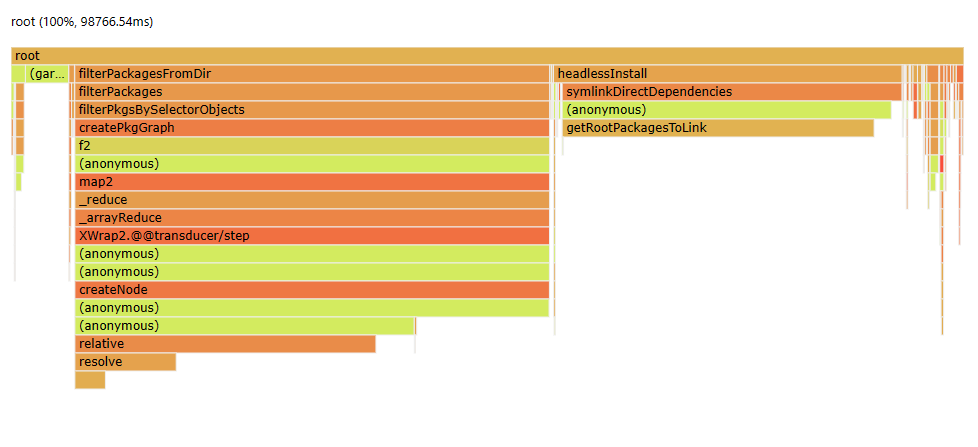
Already, I’m excited; this is every profiler’s dream. Two very obvious chunks of
work attributed to real names I can search for. Roughly 50 seconds are spent in
createPkgGraph and another 32 seconds in getRootPackagesToLink. I should
note that at this point in my adventure, I know absolutely nothing about how
pnpm works; I haven’t even checked out the repo. But, now I know exactly where
to look! (If pnpm had been minified, I’d be in a much worse position.)
Working through the code
From the get-go I can see that there’s a lot of time spent in resolve. One
thing I hadn’t mentioned was how I set up this huge monorepo; my
initial version
of the monorepo transition used version specifiers like workspace:../node to
directly map packages to each other, avoiding the need for us to specify
names/versions in every package.json (they’re already auto-generated by the DT
publisher). Without even looking at the code, I (correctly) guessed that these
paths were involved in the slowdown and
filed an issue.
It turns out that this path mapping is actually a negative for other reasons as well, so I just rewrote my transform to use versions instead of paths. After switching to this new version, the profile looks like this:
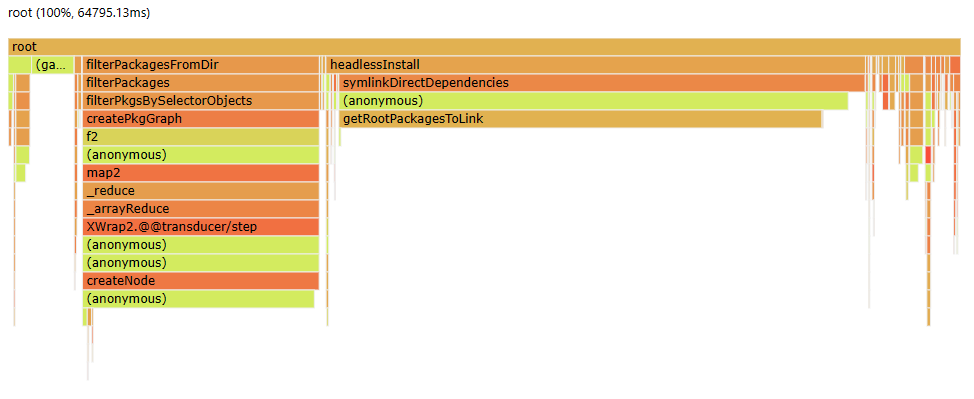
Alright, that’s better already, down from ~100 seconds to 64 seconds. We’ll come
back to resolve later.
createPkgGraph
The first block is the first “very long pause” (which happens even in the “new”
version of the repo), so let’s start there. Searching the pnpm codebase, I
find the offending function. It looks something like this (cut down for
brevity):
function createPkgGraph(pkgs: Array<Package>) {
    const pkgMap = createPkgMap(pkgs);
    return mapValues((pkg) => ({
        dependencies: createNode(pkg),
        package: pkg,
    }), pkgMap);

    function createNode(pkg: Package): string[] {
        const dependencies = {
            ...pkg.manifest.devDependencies,
            ...pkg.manifest.optionalDependencies,
            ...pkg.manifest.dependencies,
        };

        return Object.entries(dependencies)
            .map(([depName, rawSpec]) => {
                const isWorkspaceSpec = rawSpec.startsWith("workspace:");
                const spec = npa.resolve(depName, rawSpec, pkg.dir);

                if (spec.type === "directory") {
                    const matchedPkg = Object.values(pkgMap).find((pkg) =>
                        path.relative(pkg.dir, spec.fetchSpec) === ""
                    );
                    return matchedPkg?.dir;
                }

                const pkgs = Object.values(pkgMap).filter((pkg) =>
                    pkg.manifest.name === depName
                );

                if (pkgs.length === 0) return "";

                const versions = pkgs.filter(({ manifest }) => manifest.version)
                    .map((pkg) => pkg.manifest.version) as string[];

                if (isWorkspaceSpec && versions.length === 0) {
                    const matchedPkg = pkgs.find((pkg) =>
                        pkg.manifest.name === depName
                    );
                    return matchedPkg!.dir;
                }

                if (versions.includes(rawSpec)) {
                    const matchedPkg = pkgs.find((pkg) =>
                        pkg.manifest.name === depName
                        && pkg.manifest.version === rawSpec
                    );
                    return matchedPkg!.dir;
                }

                // ...
            })
            .filter(Boolean);
    }
}
Alright, so we can sort of see what might be going on here. First off, we have
pkgMap. By attaching to the code and looking at the variable, we find that
it’s an object which consists of all 9,000+ packages. So doing anything with
that is going to take a while.
At the top level, we’re already looping over every entry in the object via
ramda’s mapValues. But, if we look inside createNode, we can see that it is
also looping over all of pkgMap by calling Object.values(pkgMap)! This is
quadratic; we’ll be doing 9,000 x 9,000 scans over the array. We could fix this
by instead creating a mapping and accessing it instead. For example, one of the
loops is just looking for all of the entries in pkgMap where
pkg.manifest.name is some value. We could precalculate this mapping, producing
an object of type Record<string, Package[]>.
The other loop is more complicated; this is where resolve comes in. We can see
that we’re searching not for a specific name but for a specific set of packages
whose paths map the one we specified (that workspace:../node from earlier).
This one is tricky, but it’s possible that we could precalculate some table here
too, depending on how sensitive this code is to path.resolve’s
platform-specific semantics.
Speaking of precalculating… We just said that pkgMap was huge. But, for
every call to createNode, we call Object.values(pkgMap)! The profile doesn’t
explicitly state so, but this is really, really expensive. The good news is that
pkgMap is never modified. This means that we could calculate this big array
once and then reuse it, for example:
function createPkgGraph(pkgs: Array<Package>) {
    const pkgMap = createPkgMap(pkgs);
    const pkgMapValues = Object.values(pkgMap); // <-- NEW!
    return mapValues((pkg) => ({
        dependencies: createNode(pkg),
        package: pkg,
    }), pkgMap);

    function createNode(pkg: Package): string[] {
        // ...

        return Object.entries(dependencies)
            .map(([depName, rawSpec]) => {
                // ...

                if (spec.type === "directory") {
                    const matchedPkg = pkgMapValues.find((pkg) =>
                        path.relative(pkg.dir, spec.fetchSpec) === ""
                    );
                    return matchedPkg?.dir;
                }

                const pkgs = pkgMapValues.filter((pkg) =>
                    pkg.manifest.name === depName
                );

                // ...
            })
            .filter(Boolean);
    }
}
This turns out to save the bulk of the time. Yay!
Algorithmically, the code is still quadratic, but it’s still a lot faster and this kind of change is very safe, safe enough to be backported. I sent this one as a quick PR, and it’s now out in v7.30.4.
The fix to the quadratic-ness is going to be a different, more complicated change I plan to send later.
UPDATE: Later is now the past! All of the quadratic-ness has been fixed as of:
- perf(pkgs-graph): speed up createPkgGraph by using a table for manifest name lookup
- perf(pkgs-graph): speed up createPkgGraph when directory specifiers are present
getRootPackagesToLink
Let’s look at the second big chunk. Cut down for brevity again, we have:
async function getRootPackagesToLink(
    lockfile: Lockfile,
    opts: {/* some options */},
) {
    const importerManifestsByImporterId = {};
    for (const { id, manifest } of opts.projects) {
        importerManifestsByImporterId[id] = manifest;
    }

    const projectSnapshot = lockfile.importers[opts.importerId];
    const allDeps = {
        ...projectSnapshot.devDependencies,
        ...projectSnapshot.dependencies,
        ...projectSnapshot.optionalDependencies,
    };

    return (await Promise.all(
        Object.entries(allDeps)
            .map(async ([alias, ref]) => {
                // ...

                return {
                    // a bunch of props
                };
            }),
    ))
        .filter(Boolean) as LinkedDirectDep[];
}
Again, the profile is not being very specific. It’s just saying that a lot of
time is being spent in getRootPackagesToLink. Thankfully, there’s not much
code actually inside this function. It can only be the calculation of
importerManifestsByImporterId, or the spread to produce allDeps.
I debugged this to try and get the size of these elements.
getRootPackagesToLink is called for every package in the repo, and allDeps
is small. So that’s not likely to be it.
The importerManifestsByImporterId loop, on the other hand, is suspicious. I
just said that getRootPackagesToLink is called once per package in the repo.
But, opts.projects is a big list of all packages in the repo! We’re
quadratic again!
This is better than before, in theory; there are lookups inside the .map call
below, but they’re efficient because they don’t loop over opts.projects (as
opposed to createNode from earlier, which does do the linear lookup). But,
getRootPackagesToLink is recreating this mapping every single time it’s
called!
If we scroll down a little bit, we can find its sole caller:
const projectsToLink = Object.fromEntries(
    await Promise.all(
        projects.map(async ({ rootDir, id, modulesDir }) => [id, {
            dir: rootDir,
            modulesDir,
            dependencies: await getRootPackagesToLink(filteredLockfile, {
                // ...
                projects,
                // ...
            }),
        }]),
    ),
);
There’s that “for each package” thing again. Thankfully, we can again see that
projects is not changing between calls. So, we can instead calculate this
mapping once and pass it in to getRootPackagesToLink, again without changing
much logic.
const importerManifestsByImporterId = {} as { [id: string]: ProjectManifest; };
for (const { id, manifest } of opts.projects) {
    importerManifestsByImporterId[id] = manifest;
}

const projectsToLink = Object.fromEntries(
    await Promise.all(
        projects.map(async ({ rootDir, id, modulesDir }) => [id, {
            dir: rootDir,
            modulesDir,
            dependencies: await getRootPackagesToLink(filteredLockfile, {
                // ...
                importerManifestsByImporterId,
                // ...
            }),
        }]),
    ),
);
Now drop the code to produce the mapping from getRootPackagesToLink and we’re
done.
I sent this as a PR over too, and it also is available in v7.30.4.
The “final” result (for now)
Now that we have these two fixes in, let’s re-profile pnpm install for the
newer version:
$ npx --package=pnpm@7.30.4 -c 'pprof-it $(which pnpm) install'
# ...
Done in 13.6s
Immediately, the difference is evident. There’s no longer a huge delay before I get the cycle warning. The whole thing now takes 13.6 seconds. That’s a huge improvement! It’s outlandishly good to be processing 9,000+ packages in such a short time.
What about the profile, though?
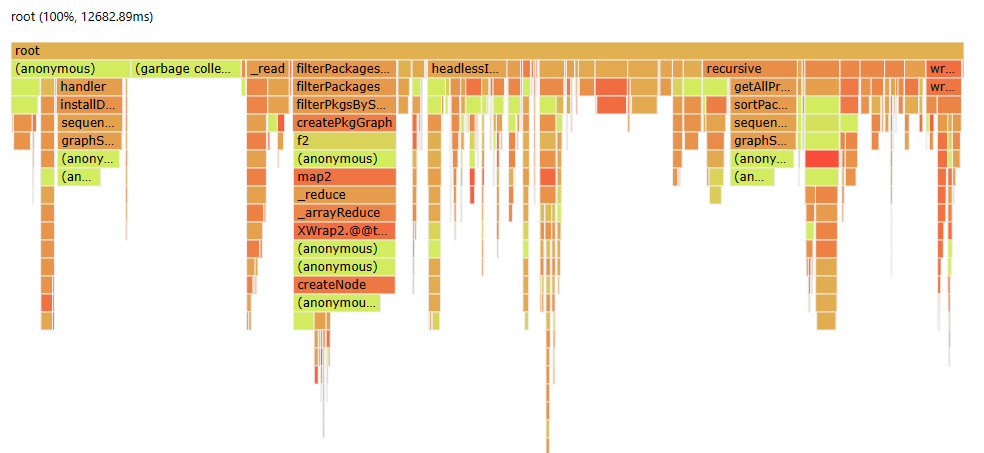
Much different. We can see that the huge obvious blocks are gone, leaving us
with a bunch of small stuff (if two obvious chunks were “the dream”, a bunch of
small stuff is “the nightmare”). We can still see that createPkgGraph is still
the most obvious chunk, lending to the fact that we didn’t fix the fact that
it’s quadratic. But, if we fix that, that’ll be a few more seconds saved! And,
we can profile it again, and maybe we can look into sequenceGraph or
getAllProjects, the next big chunks.
Recapping
To recap, we:
- Ran
pnpmon a huge monorepo, and found it to be suspiciously slow, visibly hanging at times. - Ran
pprof-itto take a look under the hood. - Found a couple of big candidates for optimization.
- Stared at some code.
- Got lucky, addressing both problems by simply shifting some code around.
- Made
pnpm4x faster! (For this super ridiculous test case, anyway.)
I hope this was informative. Profiling is an excellent trick to have in your toolbox. Sometimes, you’ll be unlucky and it won’t show you much. But, when you do find something, it’s worth having spent a few minutes trying it out.
In case you’re curious what else we’ve (me and the TypeScript team) have been able to find, check out these PRs and issues:
- A performance boost from avoiding the calculation of all properties of unions / intersections where all we wanted to know is if any type matches a condition.
- A performance boost by discovering that a computation was not being cached.
- A performance regression I (unwittingly) introduced in TypeScript’s string template literals when used with intersections, with two PRs (#53406 and #53413) attempting to address it.
- A performance boost in TypeScript 5.0, where I identified that we weren’t reusing our “printers” as much as we could have, saving a few percent (and even more in some projects).
- An older PR where
pprofhad pointed out that a lot of time during a build of a TypeScript project was being spent normalizing paths, even if the platform was UNIX-like and the paths were already using the correct slashes. - A PR I sent back when I was working on Pylance/pyright, where 50% of GC time was spent concatenating strings.
-
Well, this used to be true, but might not be anymore. Definitely not if you
git blamethe TypeScript repo and forget to use.git-blame-ignore-revs! Thanks, modules. ↩︎ -
Okay, this is a fork of the original released by Google, but that one hasn’t been updated in years, and DataDog’s fork includes prebuilt binaries. ↩︎
-
This is something I’ve been meaning to dig into, but it turns out to be a problem that also happens to the more typical
.cpuprofilefiles Node performance nerds may already be familiar with, so I just haven’t prioritized looking into it. ↩︎